VMS IDE Debugger: Difference between revisions
Jump to navigation
Jump to search
| Line 17: | Line 17: | ||
: * Breakpoints can be toggled by clicking on the '''Editor''' margin or using <code>F9</code> on the current line. | : * Breakpoints can be toggled by clicking on the '''Editor''' margin or using <code>F9</code> on the current line. | ||
: * Variable values can be seen by hovering over variables in the code. | : * Variable values can be seen by hovering over variables in the code. | ||
; [7] DEBUG CONSOLE : Shows debugging output. Opens automatically as soon as debugging session starts. All program output will be on this screen. If program requires data input, enter it in the Debug Console REPL. | ; [7] DEBUG CONSOLE : Shows debugging output. Opens automatically as soon as debugging session starts. All program output will be on this screen. If the program requires data input, enter it in the Debug Console REPL. | ||
=Additional Information= | =Additional Information= | ||
Revision as of 03:55, 26 June 2019
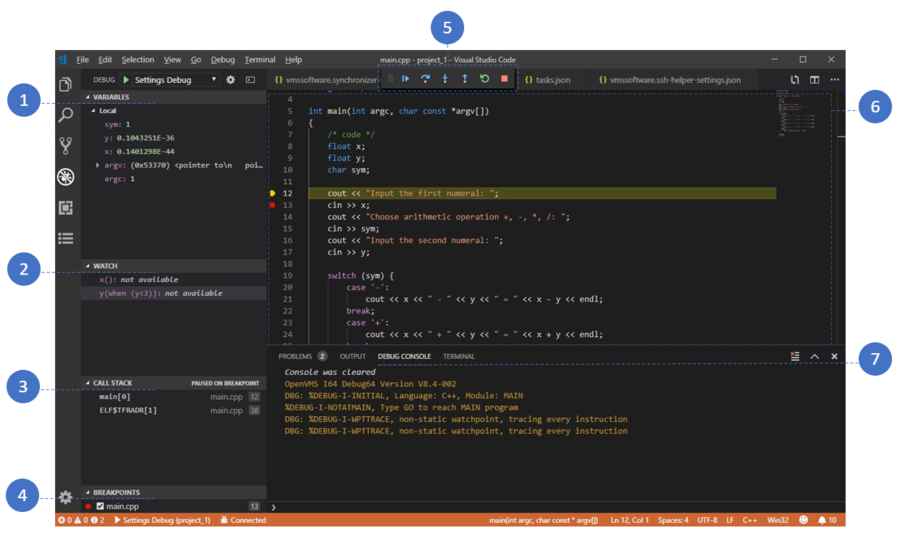
VMS IDE uses Visual Studio Code built-in debugger and supports all of its features.
Features

- [1] VARIABLES
- Shows local variables. If the panel is collapsed, variables are not requested. When debugging, you can set variable values by double-clicking them and typing a new value.
- [2] WATCH
- You can add variable names (expressions) to set watchpoints:
- * Expression without braces "()" - request variable value (local or global);
- * Expression with empty braces "()" - enable watchpoint, for example
x(); - * Expression with conditional expression in braces "(when ...)" - enable watchpoint with condition, for example
x(when (x<5)). - [3] CALL STACK
- Shows stack frames. Variables and expressions listed in VARIABLES and WATCH sections are relative to the selected stack frame.
- [4] BREAKPOINTS
- Shows breakpoints set for the current project.
- [5] DEBUG TOOLBAR
- Provides standard debugging actions. Edit field stopOnEntry in the launch.json file:
- Set field "stopOnEntry" = true to enable stop on entry.
- Set field "stopOnEntry" = false to disable stop on entry.
- [6] EDITOR
- * Breakpoints can be toggled by clicking on the Editor margin or using
F9on the current line. - * Variable values can be seen by hovering over variables in the code.
- [7] DEBUG CONSOLE
- Shows debugging output. Opens automatically as soon as debugging session starts. All program output will be on this screen. If the program requires data input, enter it in the Debug Console REPL.
Additional Information
Please view Visual Studio Code documentation to learn more about Debbuger view and debugging process in Visual Studio Code.