VMS IDE for Java (Kotlin, Scala)
Note: coming soon
Steps to run java project
- Change project settings: project type (java, scala or kotlin), project name, root folder, source, headers, resource and listing masks
- Write code
- Create MMS
- Upload
- Build
- Collect Java classes. This step is required for debugging.
- Run
Because project target will be compiled by one command for all source files please do not mix Kotlin, Scala and Java source files in one project.
Abilities
- Java, Scala or Kotlin project can depend on other Java, Scala or Kotlin projects.
Debugging
In order to use breakpoints one should execute Collect Java classes before debugging if project is changed and built.
Start
To start debugging press F5 button. If no debug configuration selected
![]()
the 'Select environment' dropdown window will be displayed.

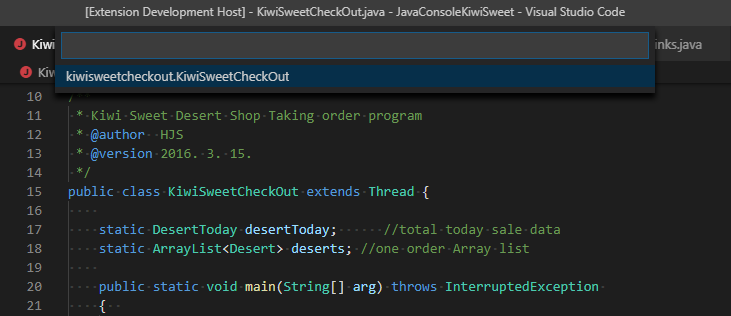
Choose 'VMS JVM Debugger'. If all java classes collected successfully the 'entry class' quickpick window will be displayed.

Select one and debugging will start.
You can configure 'launch.json' to start predefined debug configuration. To do this press 'Configure or Fix...' button on the DEBUG panel.

If there is no 'launch.json' file the 'Select environment' dropdown window will be displayed. Choose 'VMS JVM Debugger'.
If 'launch.json' file exists press 'Add Configuration' button in the right bottom side and select 'VMS IDE: Launch JVM'.
{
  "type": "vms jvm debugger",
  "request": "launch",
  "name": "Launch JVM",
  "classpath": "${command:FillClassPath}",
  "class": "${command:FillClassName}",
  "port": "5005-5105",
  "arguments": "",
  "stopOnEntry": true
}
- Do not change type and request
- Edit name
- Enter class path - A ':' separated list of directories, JAR archives, and ZIP archives to search for class files. In case of "${command:FillClassPath}" class path will be given from project settings.
- Enter full class name with the static main method. In case of "${command:FillClassName}" the 'select executable class' quickpick window will be displayed when debugging is started.
- port is diapason of ports for JDB.
- arguments is argumets string passed to the program.
- stopOnEntry whether do stop or not on the entry of the program.
Breakpoints
Breakpoints are shown grayed until corresponding class is loaded into memory. Also they are grayed if no java class information collected.
Function breakpoints
Press '+' at the breakpoints view. Enter the function name in format <full_class_path>.<method>(<arg_type1>, <arg_type2>...). You can omit any part of function name. QuickPick window with corresponding functions will appear. Select required one. If no dialog appears press 'Activate Breakpoints'.
Data breakpoints
The UI for data breakpoints doesn't exist. To create data breakpoint enter 'watch all <class>.<field>' in the input debugging console while program is paused, to remove enter 'unwatch all <class>.<field>'. This feature doesn't allow to catch changing of concrete variable, it will catch all changing of <field> for all instances of <class>. Also it doesn't work for local variables.
Displaying/Setting variables
String variable is displayed 'as is', without escaping. Char variable is escaped if its value is less than 0x20 or greater than 0x7f. To set the value of a string or char variable, you can write an escaped string (in java rules). No enclosing quotes required.
Debugging console
If the program is running, everything written in the input debugging console will be sent to the program. If the program is paused, everything written in the input debugging console will be sent to the debugger. So be careful not to break the debugger. For example 'eval a=100' will change the value of variable and this won't be caught by extension.